13 Essential Restaurant POS Reports to Boost Your Business Growth in 2025
Table of Content
- Why 2025 is a Crucial Year for Leveraging Data in Restaurant Report Management
- Why Restaurant POS Reports Matter
- Essential Restaurant POS Reports
- 1. Sales Summary Report
- 2. Hourly Sales Report
- 3. Inventory Usage Report
- 4. Product Mix Report
- 5. Employee Sales Report
- 6. Labor Cost Report
- 7. Payment Type Report
- 8. Discount and Promotion Report
- 9. Void and Refund Report
- 10. Sales by Category Report
- 11. Employee Sales Report
- 12. Comps and Voids Report
- 13. Gift Card Sales and Redemption Report
- How to Maximize Your Restaurant POS Reports
- Final Thoughts
- Frequently Asked Questions
- 1. What are restaurant POS reports?
- 2. Why are POS reports important for restaurants?
- 3. What are the key POS reports every restaurant should have?
- 4. How can POS reports help improve restaurant efficiency?
- 5. What makes Quantic POS different from other POS systems?
- 6. How frequently should I review my POS reports?
- 7. How do POS reports contribute to higher profits?
- 8. Can I access POS reports remotely?
- 9. How do I choose the best POS system for my restaurant?
- 7. How do POS reports contribute to higher profits?
In today’s competitive restaurant industry, success hinges on more than just delicious food and stellar service.
Data-driven decision-making is the key to optimizing operations, boosting profits, and staying ahead of the curve.
Modern restaurant POS (Point of Sale) systems are no longer just transactional tools.
They’re powerful analytics engines that generate actionable insights through restaurant POS reports.
These reports help owners and managers track performance, identify trends, and uncover hidden opportunities.
Why 2025 is a Crucial Year for Leveraging Data in Restaurant Report Management
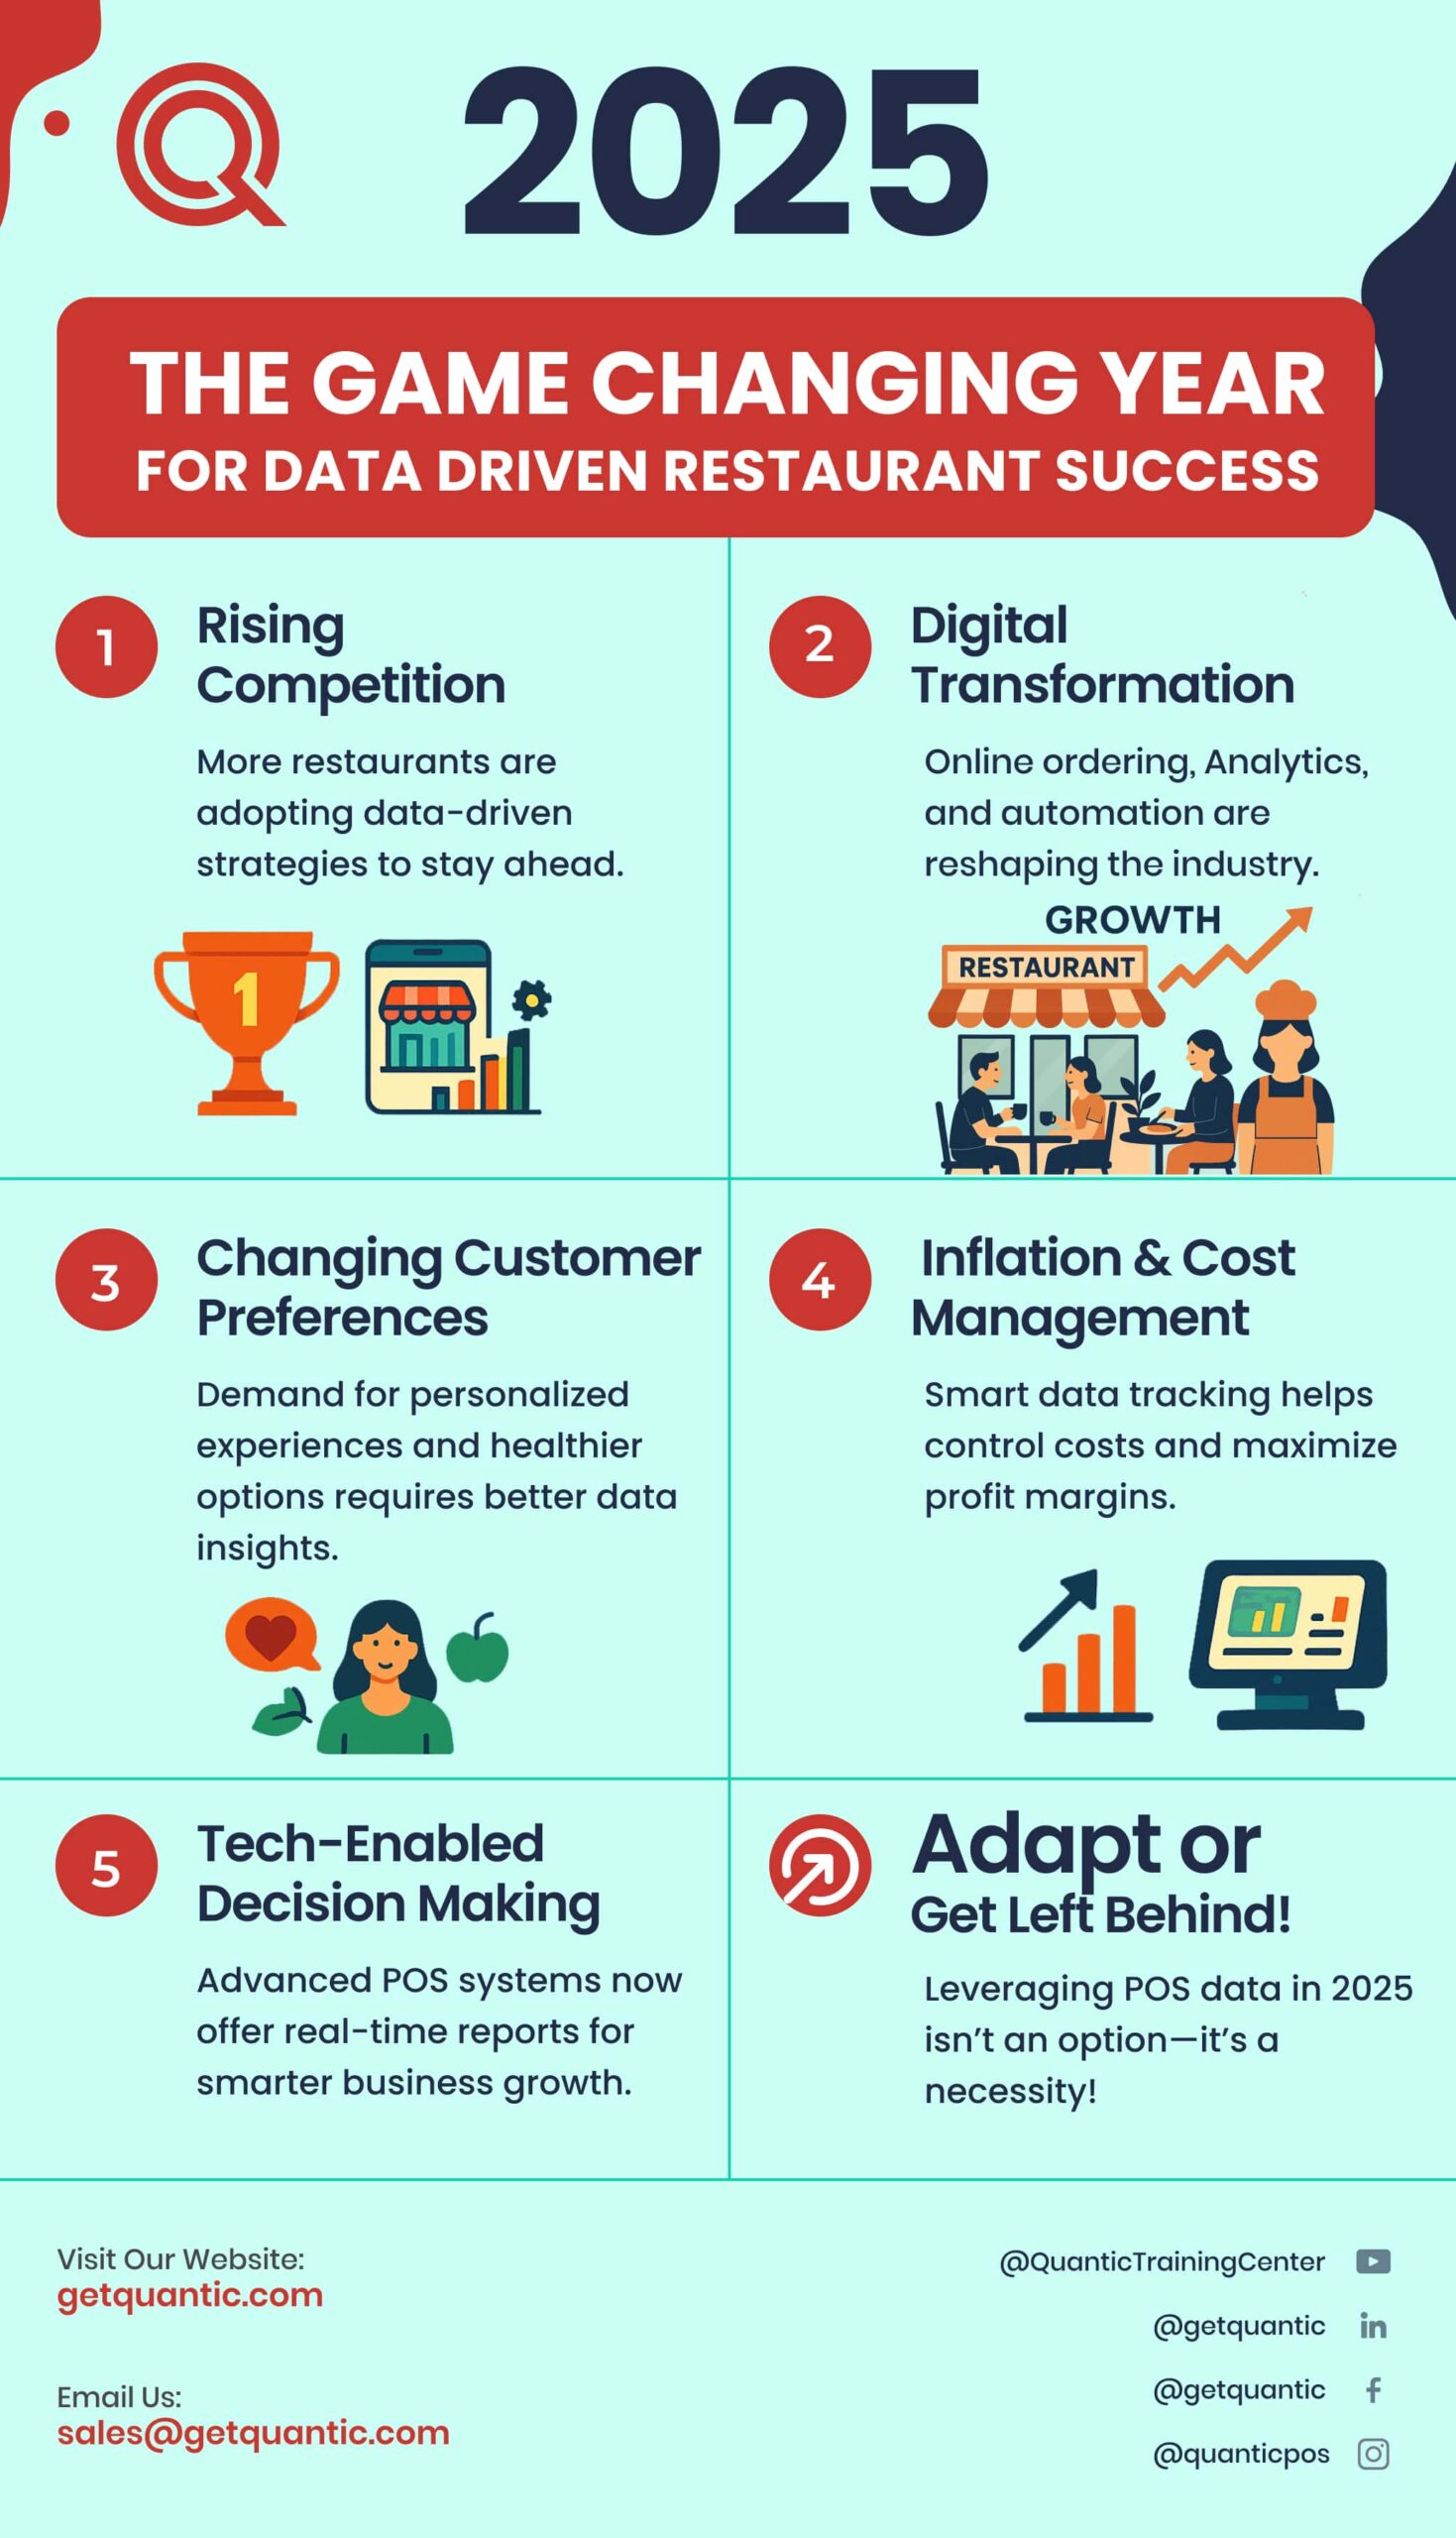
In this guide, we’ll explore the essential restaurant POS reports every operator should leverage to streamline workflows, reduce costs, and elevate the customer experience. Let’s dive in!
Why Restaurant POS Reports Matter
A restaurant POS system acts as the central nervous system of your business, capturing data from every transaction, inventory management, and staff interaction.
However, raw data alone isn’t enough. It’s the ability to analyze and act on that data that drives success.
With Quantic POS, you get powerful real-time reporting tools that translate complex data into clear, actionable insights. These reports provide visibility into:
- Sales trends – Identify peak hours, best-selling menu items, and seasonal fluctuations to optimize pricing and promotions.
- Operational inefficiencies – Detect waste, labor overages, and slow table turnover to enhance efficiency and reduce costs.
- Customer behavior – Understand ordering preferences, loyalty patterns, and spending habits to craft personalized marketing strategies.
- Financial health – Track profit margins, expense ratios, and revenue trends to ensure long-term stability.
Quantic POS reports empower you to make data-driven decisions, whether it’s refining your menu, adjusting staffing schedules, or renegotiating supplier contracts.
A robust reporting system isn’t just a convenience; it’s a competitive advantage that helps you stay ahead in an ever-evolving industry.
Essential Restaurant POS Reports
1. Sales Summary Report
What It Tracks: Daily, weekly, or monthly revenue totals, including gross sales, net
sales, taxes, and discounts.
Why It Matters: This high-level overview helps you measure overall performance and compare periods (e.g., YoY growth). Use it to set revenue goals and assess the impact of marketing campaigns.
How to Use It:
- Identify slow days/seasons and plan promotions to boost traffic.
- Track the effectiveness of menu price changes.
- Share summaries with stakeholders to highlight progress.
2. Hourly Sales Report
What It Tracks: Revenue broken down by hour or time blocks (e.g., lunch vs. dinner rushes).
Why It Matters: Reveals peak demand periods, helping you optimize staffing and inventory prep.
How to Use It:
- Schedule staff shifts to match busy hours.
- Prep ingredients in advance for anticipated rushes.
- Offer happy hour specials during slower times to attract customers.
3. Inventory Usage Report
What It Tracks: Stock levels
Why It Matters: Helps control costs by identifying overstocking, shrinkage, or theft.
How to Use It:
- Adjust purchase orders based on sales patterns.
- Spot discrepancies between recorded stock usage and sales data (e.g., 10 units of steak sold vs. 15 units deducted).
- Reduce waste by refining portioning or adjusting stock ordering.
Pro Tip: Pair this with menu performance reports to identify high-cost, low-margin items.
4. Product Mix Report
What It Tracks: Sales volume, profitability, and popularity of each menu item.
Why It Matters: Identifies star performers and underdogs, guiding menu engineering.
How to Use It:
- Promote high-margin items through upselling or visual placement.
- Retire low-selling dishes that tie up inventory.
- Test combo deals to boost slow-selling sides.
5. Employee Sales Report
What It Tracks: Sales generated by each staff member.
Why It Matters: Highlights top performers and training opportunities.
How to Use It:
- Reward employees with high upsell rates.
- Provide coaching for staff with excessive voids or refunds.
- Foster healthy competition with sales-based incentives.
6. Labor Cost Report
What It Tracks: Hours worked, wages, and labor cost as a percentage of sales.
Why It Matters: Labor is often a restaurant’s biggest expense. This report ensures you’re not overstaffing during quiet shifts.
How to Use It:
- Align schedules with hourly sales data.
- Cross-train staff for multitasking during slow periods.
- Monitor overtime to control costs.
7. Payment Type Report
What It Tracks: Breakdown of payment methods (credit, cash, mobile wallets).
Why It Matters: Highlights customer preferences and reduces transaction friction.
How to Use It:
- Negotiate lower processing fees for high-volume payment types.
- Train staff on popular digital payment systems.
- Phase out rarely used methods to simplify operations.
8. Discount and Promotion Report
What It Tracks: Redemption rates and revenue impact of discounts, coupons, or promotions.
Why It Matters: Ensures promotions drive traffic without eroding profits.
How to Use It:
- Retire underperforming promotions.
- Analyze which deals attract new vs. repeat customers.
- Avoid discount dependency by balancing offers with full-price upsells.
9. Void and Refund Report
What Tracks: Frequency and reasons for voided transactions or refunds.
Why It Matters: Uncovers operational issues (e.g., kitchen errors, POS misuse).
How to Use It:
- Address recurring menu or staff training gaps.
- Investigate potential fraud or theft.
- Streamline the refund process to retain dissatisfied customers.
10. Sales by Category Report
What It Tracks: Revenue segmented by menu categories (e.g., appetizers, entrees, beverages).
Why It Matters: Highlights which categories drive sales and which underperform.
How to Use It:
- Promote low-performing categories with specials or bundling.
- Adjust inventory purchasing based on category popularity.
- Optimize the menu layout to highlight high-margin sections.
11. Employee Sales Report
What It Tracks: Metrics like average order value.
Why It Matters: Identifies top performers and staff needing additional training.
How to Use It:
- Reward servers with high customer satisfaction scores.
- Address gaps in upselling or order accuracy.
12. Comps and Voids Report
What It Tracks: Complimentary items, comped meals, and voided transactions (with reasons).
Why It Matters: Detects patterns of waste, errors, or potential theft.
How to Use It:
- Set limits on comps/voids per shift.
- Train staff to reduce errors leading to voids.
13. Gift Card Sales and Redemption Report
What It Tracks: Gift card purchases, balances, and redemption rates.
Why It Matters: Uncovers cash flow opportunities and customer loyalty trends.
How to Use It:
- Promote gift cards during holidays or slow seasons.
- Target customers with unredeemed balances via email campaigns.
