Detailed Reporting
Your Quantic POS offers detailed and comprehensive reports to keep you well-informed about your business.
Here, we have put together the most essential reports that every restaurant owner must know to run a successful restaurant business.
You can visit these reports from the Report section under the Left Navigation of your Quantic backend portal.
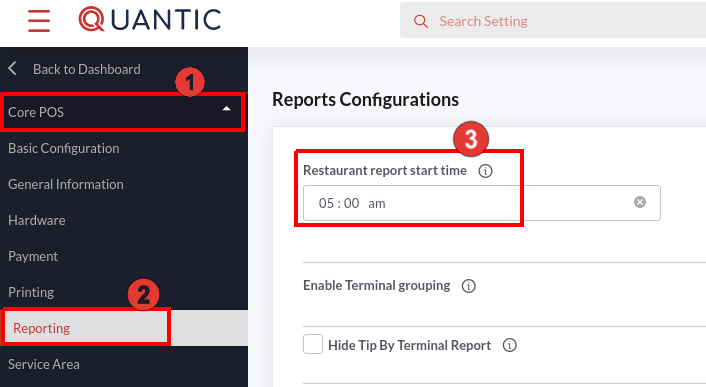
You can set the report start time for your restaurant from the Configurations section. Follow these steps to change the report start time.
- Navigate to the Configurations on the left navigation panel.
- Click to expand the Core POS section on the left.
- Tap the Reporting section.
- Click the Restaurant Report Start Time field and select the time from the time picker drop-down.
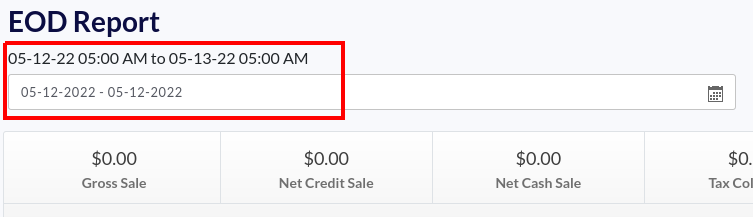
Please be informed that by default, the report will end at the same time the next day.
For example, it's the 12th day of May month and you have set the Restaurant Report Start Time as 05:00 am, the report will run from May-12th-2022 05:00 am to May-13th-2022 05:00 am.
The same start and end time will be applicable to all the reports.
However, you can also change the timings directly from the report by clicking the time picker under a particular report.
EOD Reports / Sales Summary
Sales figures are the most vital aspect of your business.
Taking full control over it requires a good understanding of EOD reports.
These reports or sales summaries include:
- Net sales.
- Sales breakdown by service area and payment methods.
- Sales statistics.
- Tips, Discounts, Comp, and Void report.
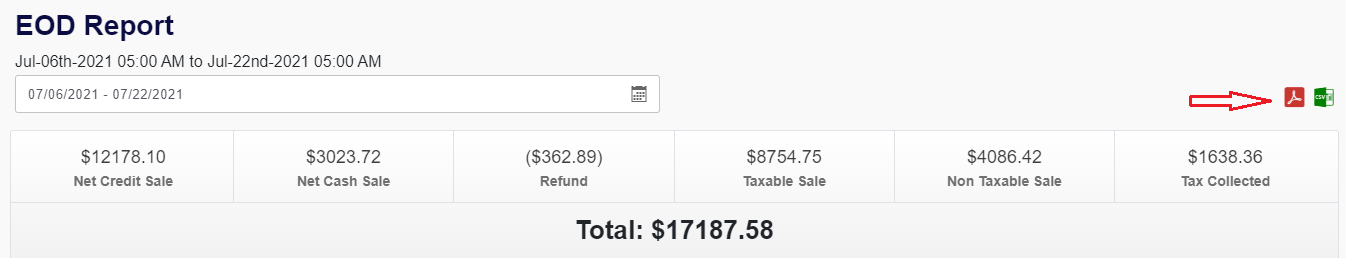
Net Sales Report
This is the first report you will see under the Sales Summary.
It shows the sales figures for the selected date range in a tabular form.
You can change the date from the top tabs to view the net sales data for a particular date range.
To have these data in PDF or Excel format, you can simply click the PDF and Excel icons on the top right, as seen in the screenshot.
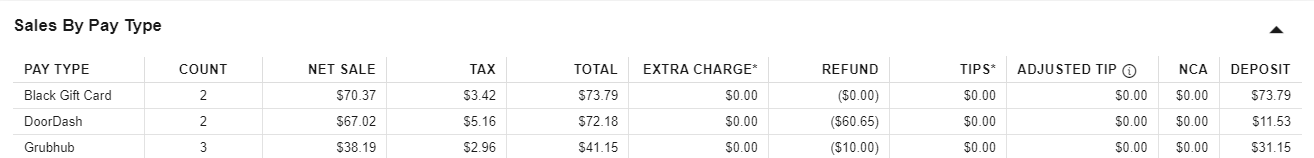
Sales by Pay Type
Sales by Pay Type data shows the type of payment methods used in your restaurant.
The above illustration informs the data you will get to see through this report.
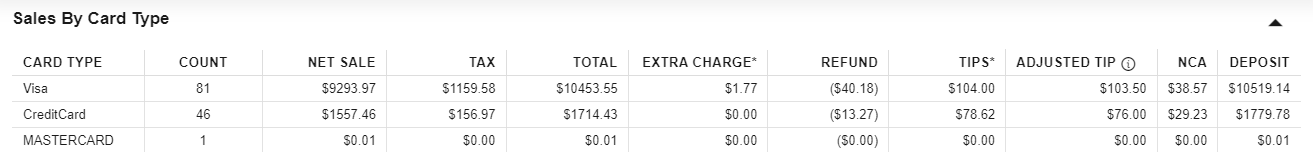
Sales by Card Type
Sales by Card Type displays the type of cards the customers have used to pay for an order.
You will get a complete overview of the number of times the card type has been used, net sales made, tax deducted, refunds, tips, and any other extra charges.
On the extreme right, you will also see the Adjusted Tip, which is the tip after deducting the credit card fees
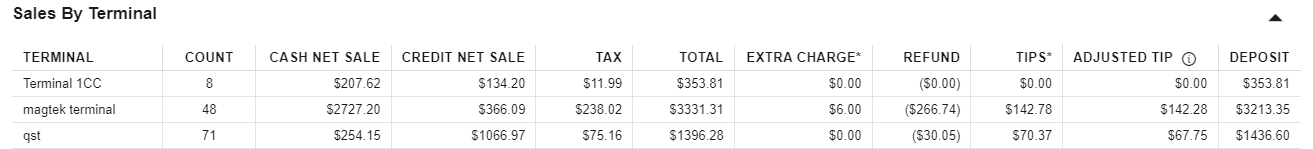
Sales by Terminal
You can have multiple terminals at your restaurant.
The Sales by Terminal data will update you about the transactions done at each terminal.
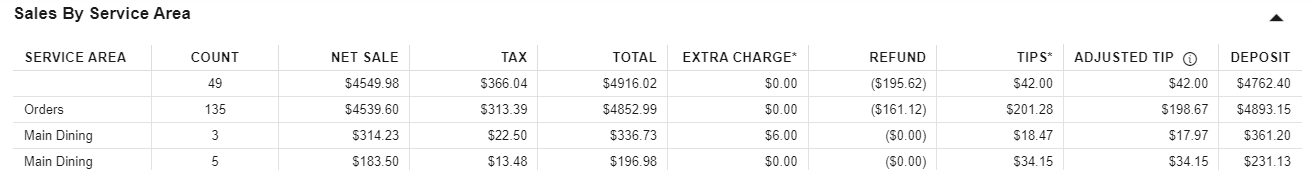
Sales by Service Area
Restaurants having multiple service areas may gather knowledge about the performance of the individual service areas.
As seen in the above screenshot, you can check net sales collected, tax deductions, tips, and refunds, etc.
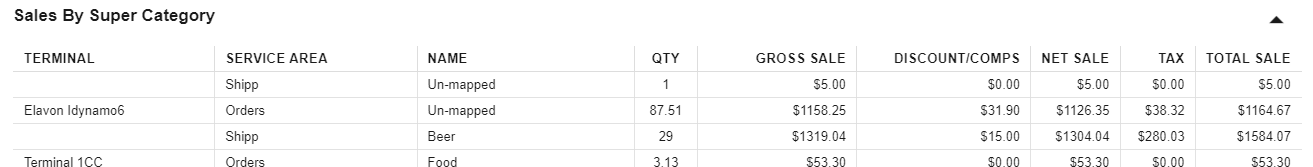
Sales by Super Category
The Sales by Super Category chart fits the bill for those who want to see which Super Category is bringing in impressive revenues.
Accordingly, you can change your menu and introduce more high-selling Super Categories in your restaurant.
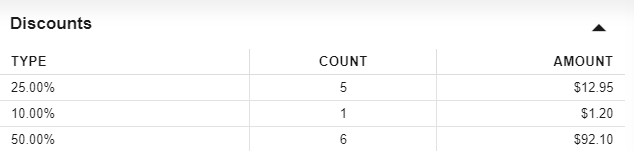
Discount Details
Here you can see the discount types that have been redeemed the most, their count, and the amount redeemed in total.
Sales Statistics
These sales statistics tell you the orders received within a particular time frame, the average check size, the total guests you’ve served, total closed orders, open orders, and the tax-related details.

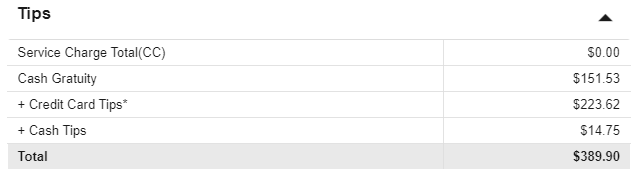
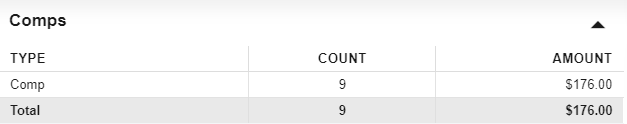
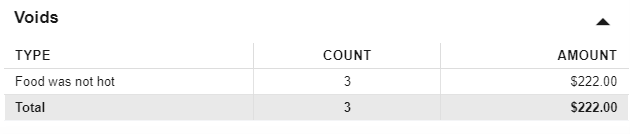
Tips, Comps, and Voids
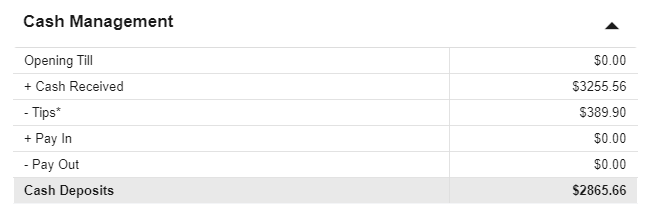
Cash Management Report
This data informs you of the Opening Till amount in the cash drawer and the total cash received.
The final cash deposit is calculated in the last row after subtracting the Tips and the Pay Out amount.

Cash Out Report
Cash Out report provides information about cash removed from active or open drawers.
This feature is typically used when there is excess cash in the drawer and it needs to be transferred to another safe location.
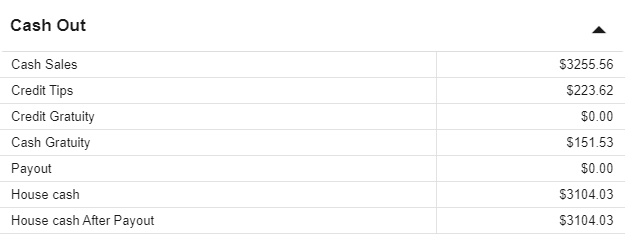
Cash Sales - This is the total sales in cash.
Credit Tips - This form of tip includes credit card tips or any other tips accumulated from any non-cash payment. It is given in cash to the employees at the end of the day.
Credit Gratuity - This is a service charge gratuity added using a credit card.
Cash Gratuity - It is the service charge gratuity for orders that are settled in cash.
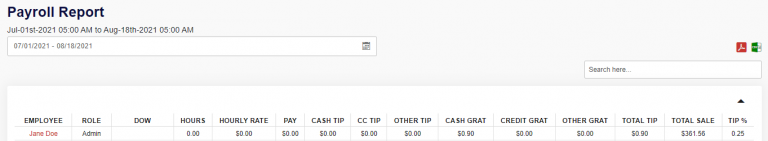
Payroll Report
This report contains payroll-related information about an employee.
You can select a date range from the top of the report to view different variables.
Here are the headings that are filled in a typical payroll report.
| Employee | This is the name of an employee. |
|---|---|
| Role | This is the role of an employee in your organization. |
| DOW | This is the last login day of an employee. |
| Hours | These are the working hours of an employee. It is calculated between the last login until today or the last logout. |
| Hourly Rate | This is the rate an employee charges for an hour of service. |
| Pay | This is calculated automatically by multiplying the Hours and the Hourly Rate. |
| Cash Tip | This is the tip amount an employee has earned in cash within a selected time period. |
| CC Tip | This is the tip amount that the customer(s) has paid to an employee in credit. |
| Other Tip | This includes tips earned from any other sources. |
| Cash Grat | It is the service charge gratuity for orders that are settled in cash. |
| Credit Grat | This is a service charge gratuity added using a credit card. |
| Other Grat | Any other gratuity will be added to this section. |
| Total Tip | This includes the total tip earned. |
| Total Sale | This is the total sales an employee has attained. |
| Tip% | This is automatically calculated by dividing Total Tips by Total Sales. This gives an idea of what percentage of total sales comes as a tip. |
Employee Sales Report
Quantic POS provides you with a full-fledged employee sales report, which can be used for performance assessment of individual employees.
From the Quantic backend, tap the left navigation button, select Reports, and go to the Employee under the Employee Report section.
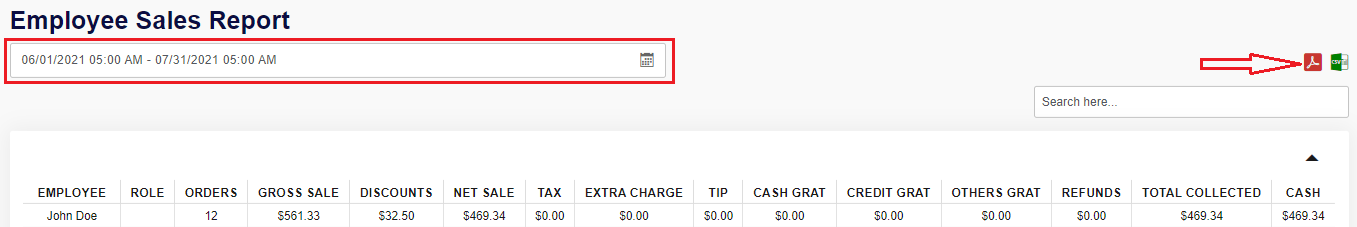
- Use the Calendar drop-down to select the start date and end date within
which you want to track the employee sales report. - You can download the reports in PDF and Excel format using the icons on
the extreme right (check the above screenshot). - The report includes the following details:
- Name of the employee.
- The role he/she has been assigned in the restaurant.
- Total orders he/she has served within a particular timeframe.
- The gross sales and net sales (in $) by an employee.
- Tax paid on orders.
- Extra charge (if any).
- Tips earned.
- Cash gratuity - A service charge gratuity for orders that are settled in cash.
- Refunds made to the customers.
- Total collection and the cash in hand.
Product Mix Report
The Product Mix report delivers accurate information about how different products are performing and affecting your sales.
This helps you to increase the inventory of most selling products and drop those that sell the least.
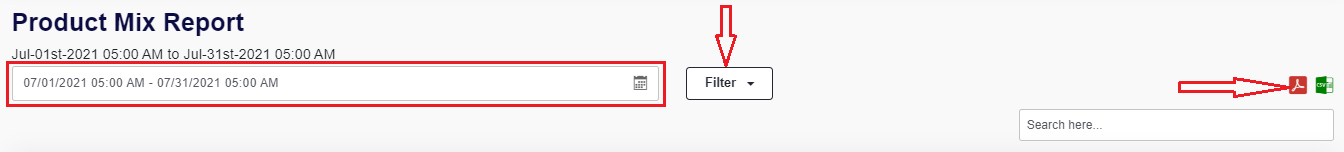
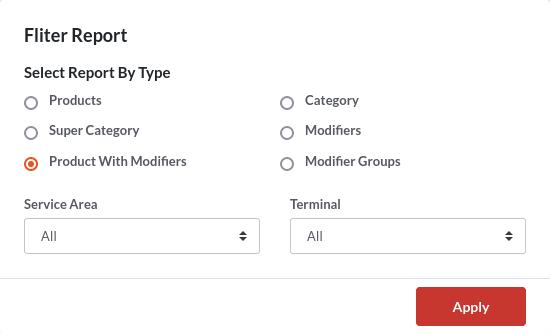
Use the Filter button to customize the reports as per Products, Category, Super Category, Modifiers, and Modifier Groups and Product with Modifiers.
Select the service area and terminal and click Apply.
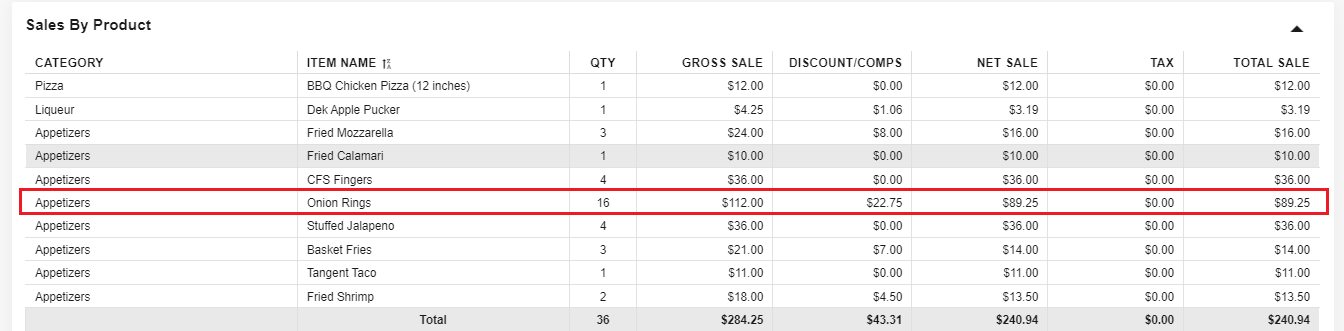
This is an example of a Sales by Product report. It shows the item category, item name, the item quantity sold, gross sales ($), discounts/comps offered, net sales, tax, and total sales.
In the illustration, the ABC restaurant has sold 16 quantities of onion Rings and generated $89 in revenues.
With these stats, it’s proven that the Onion Rings are the most selling product, hence the ABC restaurant must have this product in sufficient quantity.
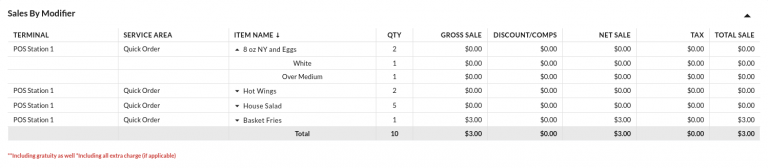
Here is another report type, “Product with Modifiers”, that shows the item+modifier combination sold within a particular date range.
To view this report, you can simply select Product with Modifiers, choose the services area and terminal, and click Apply.
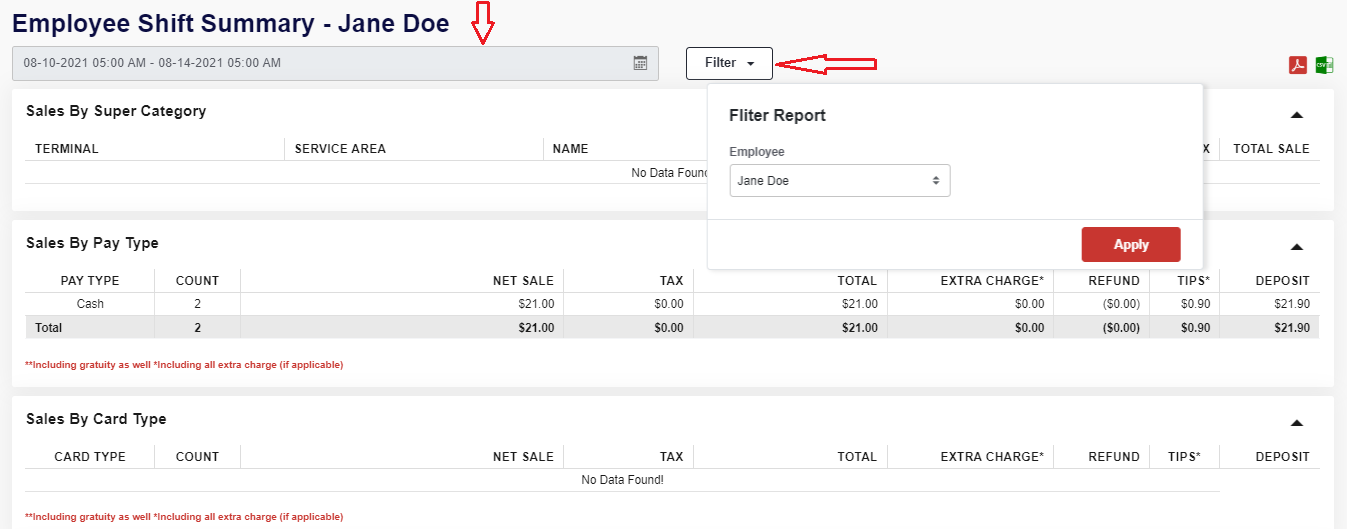
Employee Shift Summary
This report shows the employee shift summary from the last clock-in until now.
The date range comes preselected, which displays Start Time as the last clock in time and End Time as the current time.
Tap the Filter button to select an employee from the list for whom you want to see the shift summary.
The sales summary displayed will be categorized by Super Category, Pay Type, Card Type, and Order.
Sales by Super Category
This displays the employee shift summary based on the Super Category. It displays the columns with following headings.
| Terminal | It displays the terminal name. |
|---|---|
| Service Area | It shows the Service Area where a Super Category has been sold. |
| Name | This is the name of the Super Category. |
| Quantity | This is the number of categories sold. |
| Gross Sale | This is the sale transaction for a particular Super Category. |
| Discount/Comp | This is the value of discounts or comp redeemed. |
| Net Sale | This is Gross Sale – Discounts and Refunds. |
| Tax | It shows tax paid. |
| Total Sale | This is the total sale transactions of a Super Category after adding taxes by a chosen employee within a selected date range |
Sales by Pay Type
This displays the employee shift summary based on the Pay Type. It consists of the following columns.
| Pay Type | It shows the transaction is in cash or credit. |
|---|---|
| Count | It displays the number of transactions. |
| Net Sale | This displays the net sale made using a specific pay type (credit or cash) within a particular date range by the selected employee. |
| Tax | This is the tax levied. |
| Total | This is the total sale amount after adding net sales and taxes. |
| Extra Charge | This shows extra charge if any. |
| Refund | This is the refund amount for a prior successful transaction. |
| Tips | This shows the tips paid. |
| Deposit | This is the subtotal for a particular transaction type |
Sales by Card Type
This report displays the employee shift summary for a specific card type. The following are the heading of the column and their description.

| Card Type | The type of card used for transactions, such as MasterCard or Visa. |
|---|---|
| Count | It displays the number of transactions done using a specific card type. |
| Net Sale | This displays the net sale made using a specific card type within a particular date range by the selected employee. |
| Tax | This is the tax levied. |
| Total | This is the total sale amount after adding net sales and taxes. |
| Extra Charge | This shows extra charge if any. |
| Refund | This is the refund amount for a prior successful transaction. |
| Tips | This shows the tips paid using a specific card type. |
| Deposit | This is the subtotal for a particular transaction type |
Sales by Order
| Ref# | This is the order reference number. |
|---|---|
| Date/Time | This is the date and time of ordering. |
| Tip | This is the tip value paid for a specific order. |
| Cash Gratuity | It is the service charge gratuity for orders that are settled in cash. |
| Credit Gratuity | This is a service charge gratuity added using a credit card. |
| Extra Charge | This is the extra charge paid on an order |
| Total | The amount subtotal. |
| Paid By | Name of customer who has paid for this order. |
Cash Management Report
This data informs you of the Opening Till amount in the cash drawer and the total cash received.
The final cash deposit is calculated in the last row after subtracting the Tips and the Pay Out amount.
Cash Out Report
Cash Out report provides information about cash removed from active or open drawers.
This feature is typically used when there is excess cash in the drawer and it needs to be transferred to another safe location.
| Cash Sales – | This is the total sales in cash. |
|---|---|
| Credit Tips – | This form of tip includes credit card tips or any other tips accumulated from any non-cash payment. It is given in cash to the employees at the end of the day. |
| Credit Gratuity – | This is a service charge gratuity added using a credit card. |
| Cash Gratuity– | It is the service charge gratuity for orders that are settled in cash. |
| Payout – | This is the money paid to someone in exchange for goods or services. For example, money paid for repairs, to suppliers, etc. |
| House Cash – | This is the money left in the cash drawer after paying off the credit tips, credit gratuity and cash gratuity back to the employees. House Cash = Cash Sales – credit tips – credit gratuity – cash gratuity. |
| House Cash after Payout – | This is the house cash left after deducting the payout. |
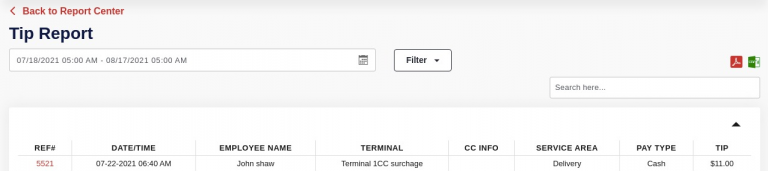
Tip Report
The tip report tells you about the tips earned by employees within a specific date range.
You can set the Start and End dates from the top and use the filter button to select Terminal, Pay Type, Employee, and Service Area.
The following are details that you will see in the Tip report.
| Ref# – | This is an order reference number. |
|---|---|
| Date/Time – | This is the date and time at which the order has been placed. |
| Employee Name – | Name of the employee who earned the tip. |
| Terminal – | This is the name of the terminal |
| CC Info – | It displays the credit card info which has been used to pay the tip. |
| Service Area – | This is the name of the service area – Bar, Main Dining, Takeout, Delivery, etc. |
| Pay Type – | It shows the mode of payment – credit card or cash. |
| Tip – | This displays the tip amount paid. |
Discount Report

This report tells you the discount/comp offered to the customers within a specific time frame and by which employee.
You can choose the Start Time and End Time from the top.
Also, you can see the report in PDF or Excel format, which adds to your convenience.

Use the Filter button to view only Comp or Discount on the list. The following are the details that you will see in the Discount report.
Use the Filter button to view only Comp or Discount on the list. The following are the details that you will see in the Discount report.
| Ref# – | This is an order reference number. |
|---|---|
| Date/Time – | This is the date and time at which the order has been placed. |
| Employee – | This is an employee’s name who took an order. |
| Manager – | This is the reporting manager’s name. |
| Discount/Comp – | This is the discount amount offered for that particular order. |
| Type – | It displays the type as Discount or Comp. |
| Code – | This is the code used to redeem the discount. |
| Applied on – | It displays whether a discount is applied on an item or an entire order. |
| Reason – | It displays the reasons for offering a discount. |
Hourly Sales Report
The hourly sales report tells about the number of items sold every hour within a particular date range.
The hour section is further expandable and shows the items sold and sale amount within that hour.
This report can be helpful for employees to analyze the sales trend within a specific time frame.
Here is the illustration of a typical Hourly Sales Report.
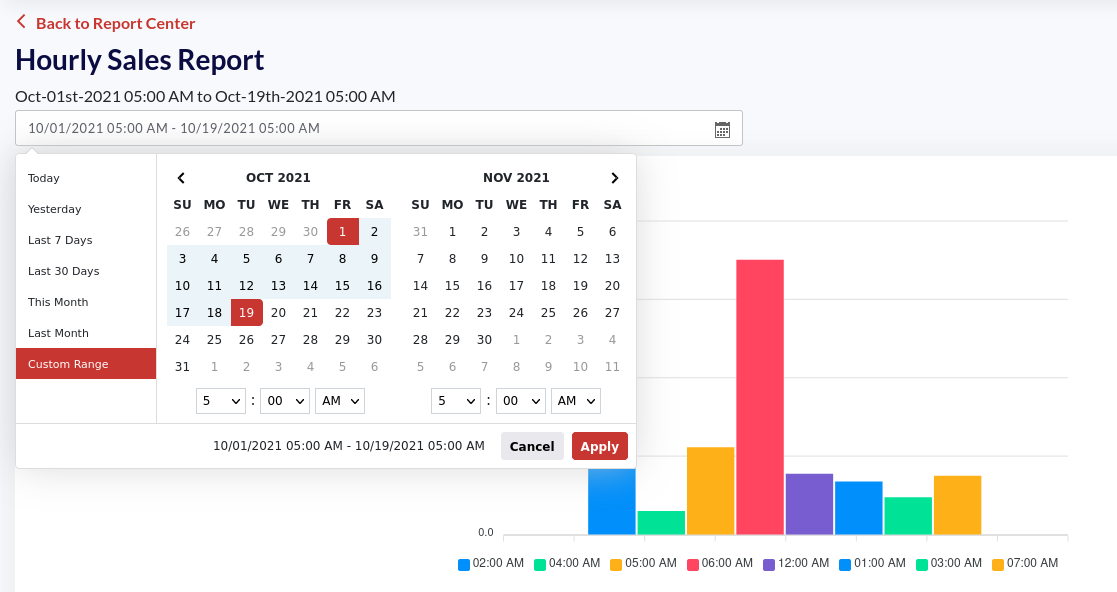
You can select the date range from the top.
Click the date picker field, select the start and end date, and click Apply.
The time vs. sale bar graph with a detailed report will appear on the screen.
Each bar represents the hour you are tracking the sales report for.
Hovering over the bars will pop up the total sale amount within that hour.
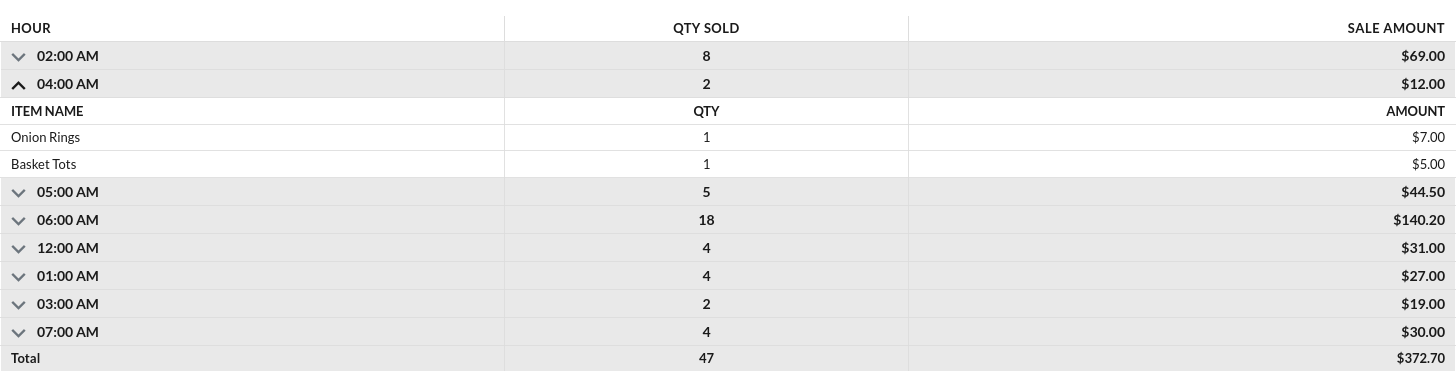
This is the detailed hourly sales report.
Hour: This is the hour you are tracking the sales report for.
QTY Sold: Total item quantity sold within the selected hour on the chosen date range.
Sale Amount: Total sale amount of the items sold within the selected hour on the chosen date range.
The Hour section can be further expanded to overview the items sold and the sale amount of an item. In this illustration, the 04:00 AM has been expanded to view the item’s details.
