Glances and Reportings
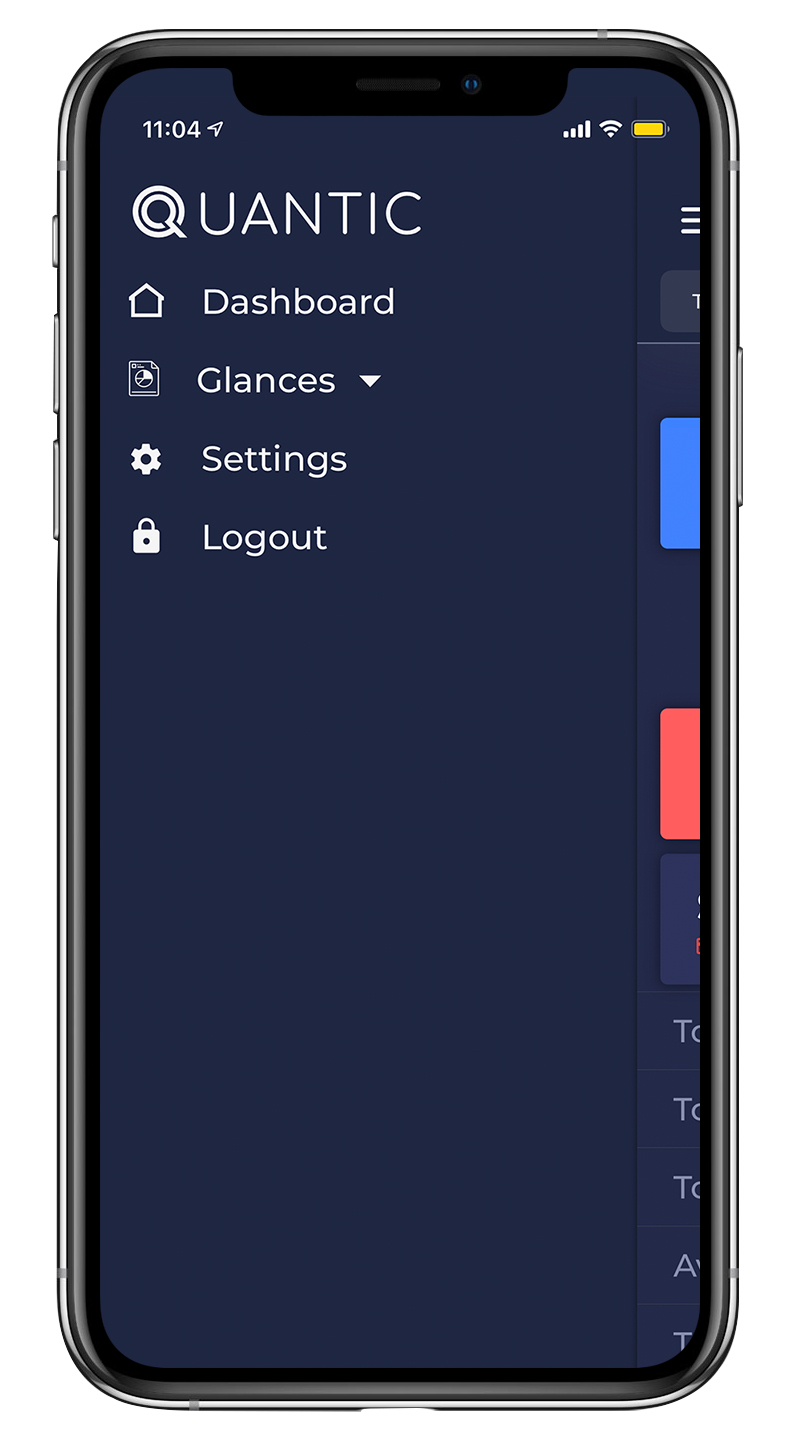
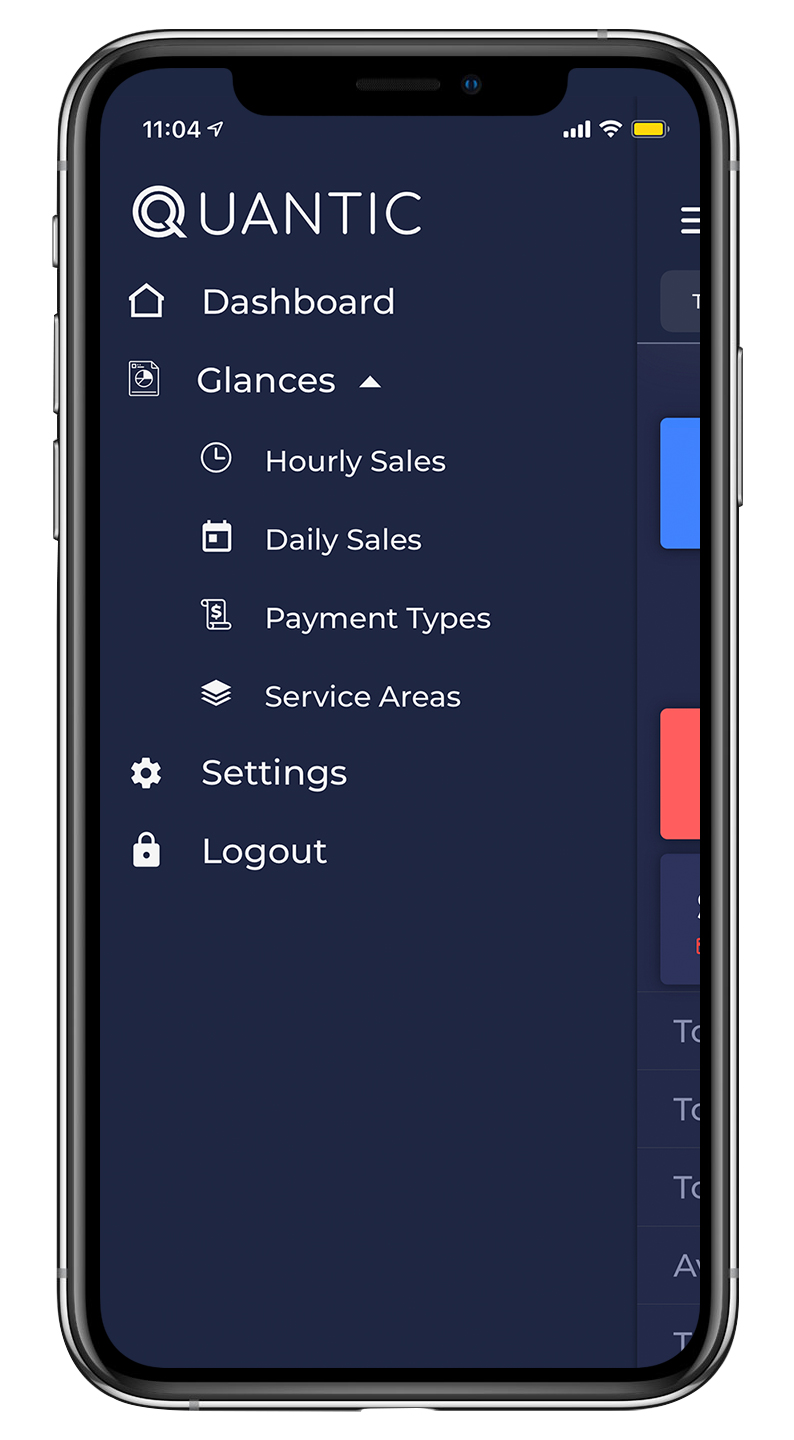
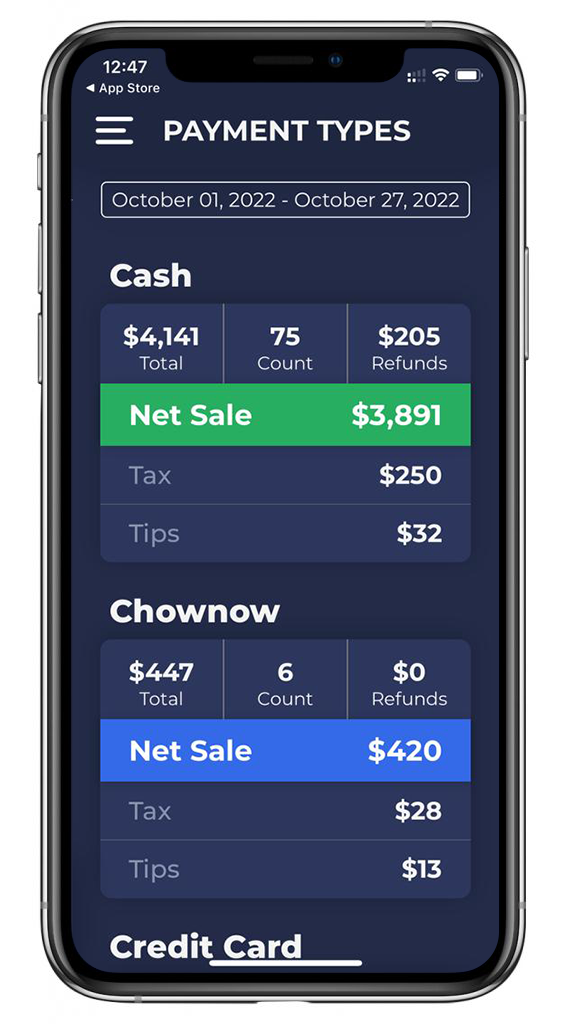
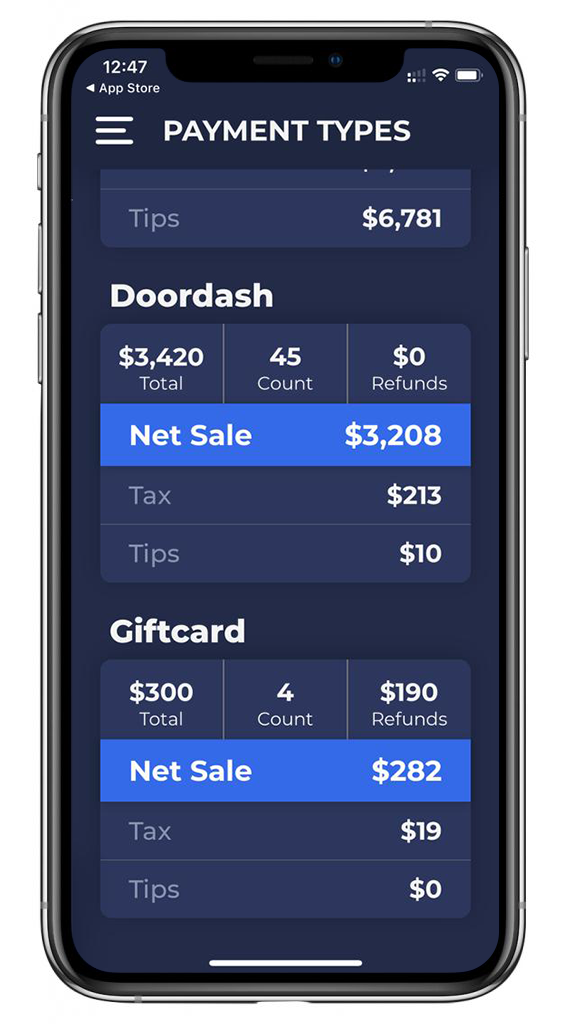
Quantic Analytics comes with smart reportings hence making it easy for you to learn about your business in the easiest possible way. We have introduced Glances which are simple, informative, and intuitive reports that provide information about hourly and daily sales. It also allows you to view the payments received for each Payment Type.
Hourly sales Glance
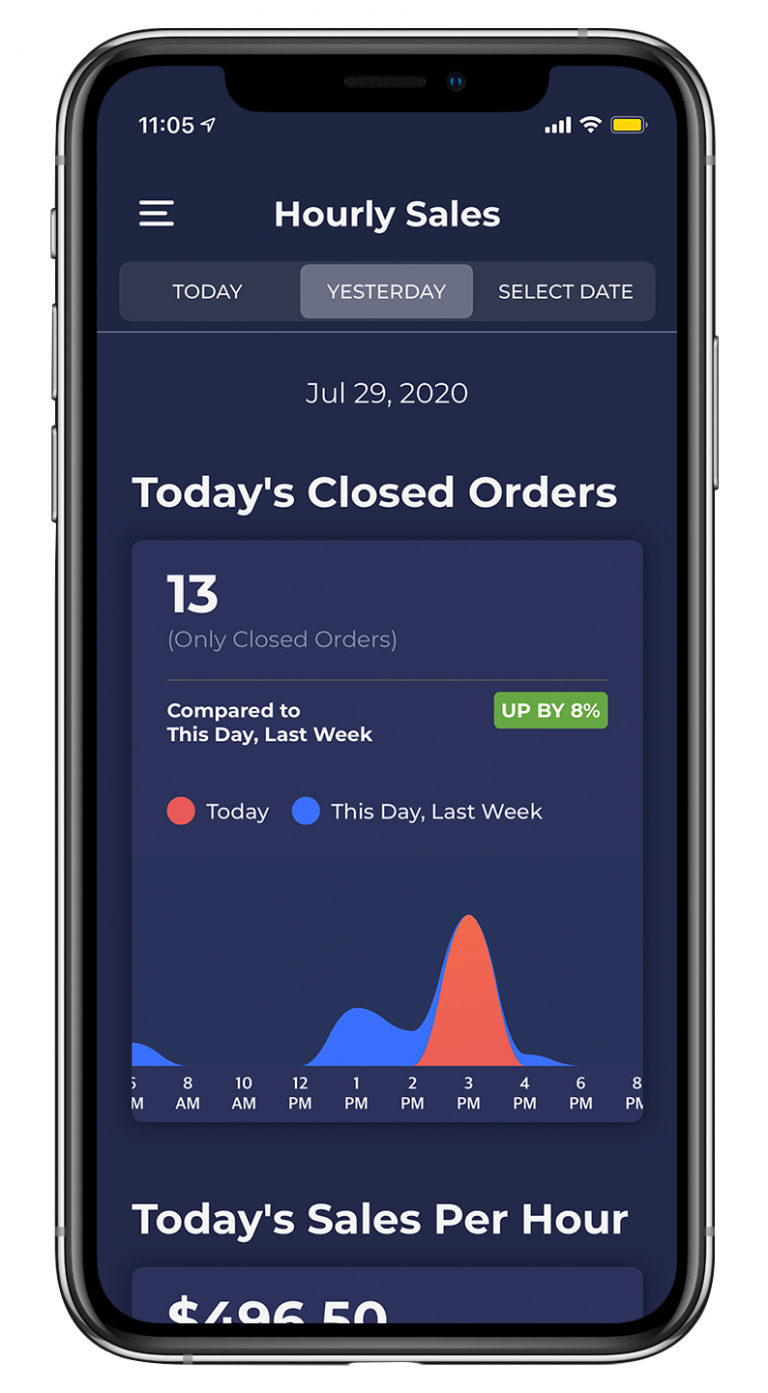
Hourly Sales will show you the sales made per hour for any particular day. You have the option to view today’s current sales, yesterday’s sales, or you can select a custom date range.
Today’s Closed Orders
The chart will show you the closed orders as they accumulate throughout the day. You can also check the business performance on This Day, Last Week on top of the chart. For instance, up by 4% or down by 4% as compared to the last week.
The graph
below shows the comparison between Today and This day, last week. You can get a report of every hour using this graph.
Today’s Sales Per Hour
It will show you the total sales achieved per hour (average figure in $).
These three metrics
Are all present in the Today, Yesterday, and Select Date (custom) menu options.
Daily sales Glance
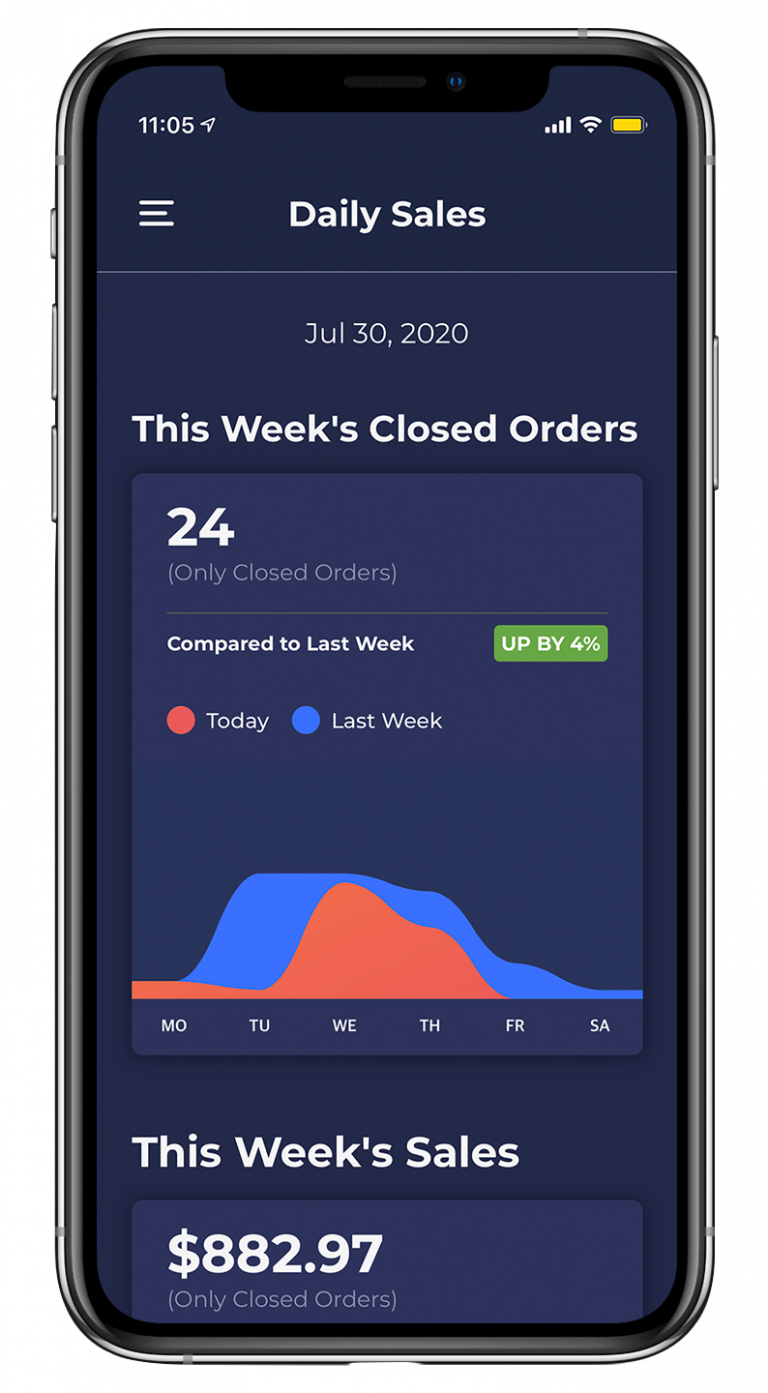
The second Glance option that you have is Daily Sales. This Glance will display the number of closed sales per day throughout one workweek. There are two graphs on this screen – This Week’s Closed Orders and This Week’s Sales.
This Week’s Closed Orders
Represents the total number of orders closed for the period of one workweek.
This Week’s Sales
Represents the total amount of sales (in $) for the period of one workweek.
Payment Types Glance
Service Area Glance
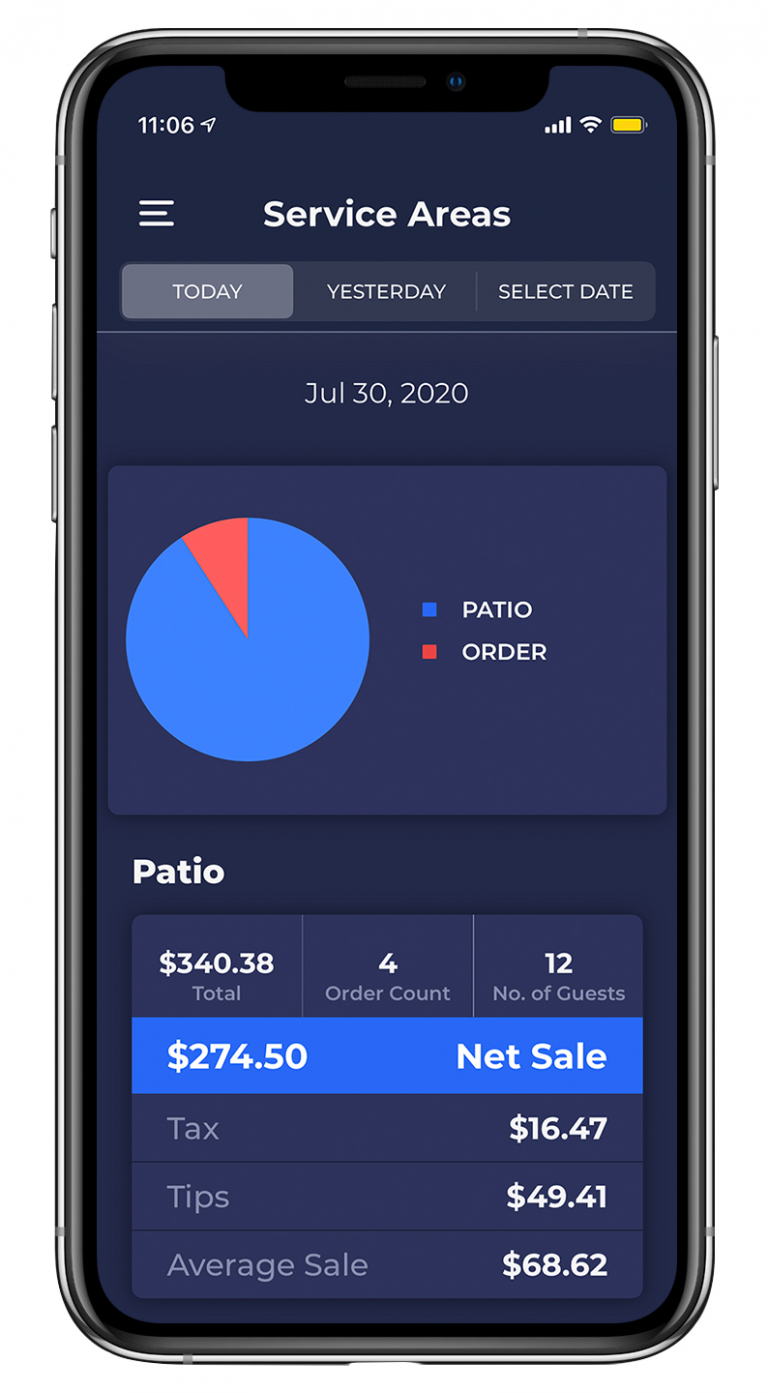
The fourth glance option is the Services Area Glance. This Glance allows you to check which service area is pulling in the most revenue to your restaurant. You have three options on the top of your screen – Today, Yesterday, and Select Date. Each option will create the same Glance which is then organized by Service Area.
- Today’s Service Areas This option will allow you to see the service areas used for the current workday as represented by orders after they are closed.
- Yesterday’s Payment Types This option will allow for a quick comparison between Today’s & Yesterday’s Service Areas and pull data from the total closed order of the previous workday.
- Custom Payment Types This allows you to see values for any custom date. Once you select this option a drop-down menu will appear and offer three additional options – Last 7 Days, Last 30 Days, Last 90 Days, or a custom range.
- Last 7 Days This glance will allow you to view net sales of each service area for a week. Please note that this would not include your current workday’s data. It begins to pull information up to one total week prior to your current workday.
- Last 30 Days This glance will allow you to view your total sales by service area up to one month prior to the current workday.
- Last 90 Days This glance will allow you to view your total sales and transactions by service area up to three months (or one standard business quarter) prior to your current workday.
- Custom Range This additional option gives you the flexibility to see the net sales by choosing a custom range of dates.
Best Sellers
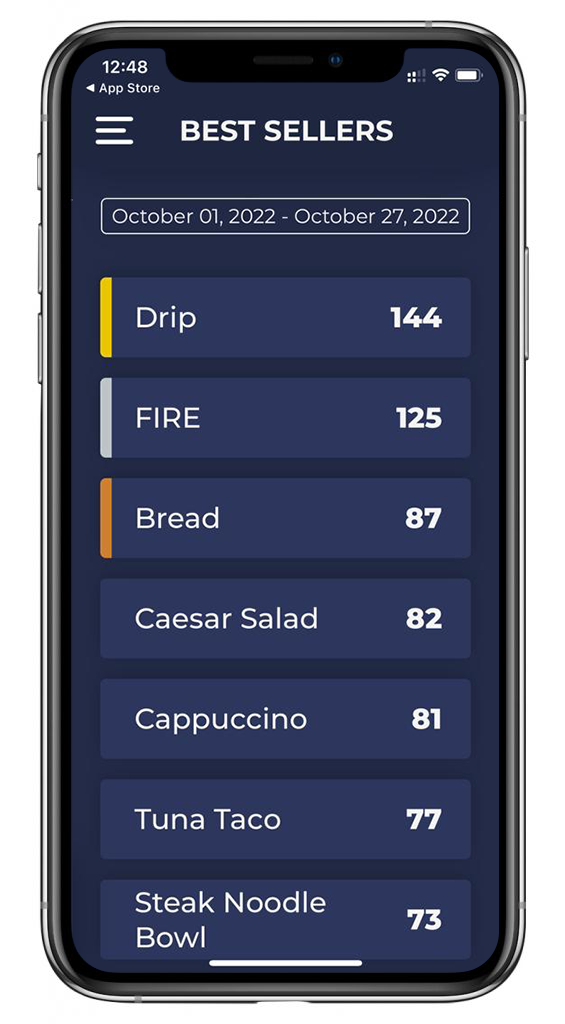
Best Sellers reporting displays the best-selling products with quantity sold during the selected date range. It can help you in maintaining an adequate item inventory based on past sales trends.
